Identifying the luckiest teams in MLB history
Wins above replacement, or WAR, is often used as the workhorse metric in analyzing Major League Baseball teams and players. The idea behind WAR is to summarize the total contribution of a player to his team in terms of additional wins that player earned his team over a so-called “replacement” player. By summing the WAR values of individual players on a team, we can directly compare teams to each other.
But WAR isn’t the be-all, end-all of baseball–winning is. So how well does WAR actually do at predicting wins? And what elements of winning can’t be captured by WAR? Does “luck” play a role? In this post, I seek to answer some of these questions and determine the luckiest teams and players of all time.
Dataset
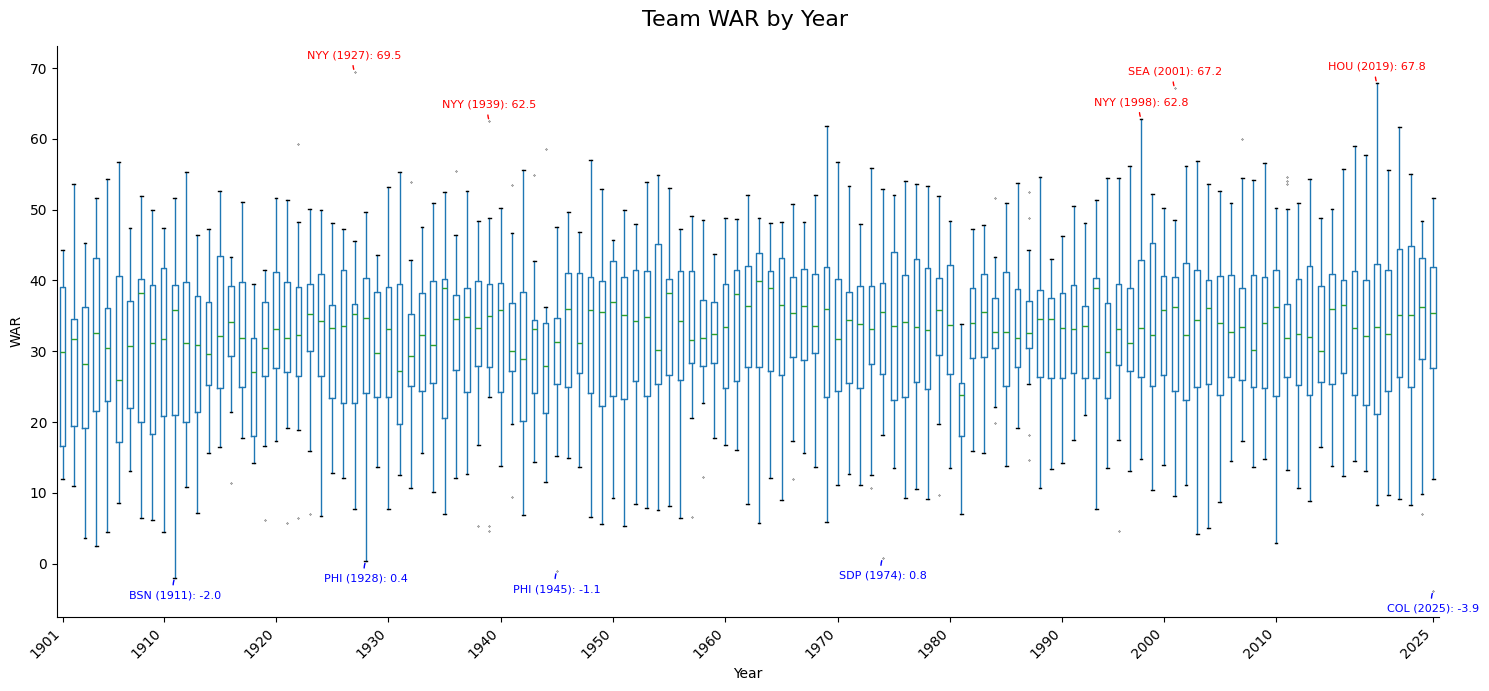
All data comes from Baseball Reference, meaning I’ll be looking at the bWAR flavor of WAR only. I pull data for all currently active teams (as of 2026) ranging back to the year 1901. I grab the regular season roster and team stats for each team for each season. Strike and COVID years are filtered out for simplicity. See the by-year distribution plot below for a summary of the data in the sample.
Analysis
The art of WAR
From the data, I run a simple linear regression of regular season winning percentage on team total WAR (adjusted for games played) and obtain the following equation:
\[\text{Win Percentage} = 0.64 \cdot \text{WAR} + 28.5\]with $R^2 = 0.82$. See below for the full regression summary:
| Metric | Value |
|---|---|
| Slope | 0.642393 |
| Intercept | 28.5139 |
| R-squared | 0.816166 |
| P-value | 0 |
| Standard Error | 6.22329e-05 |
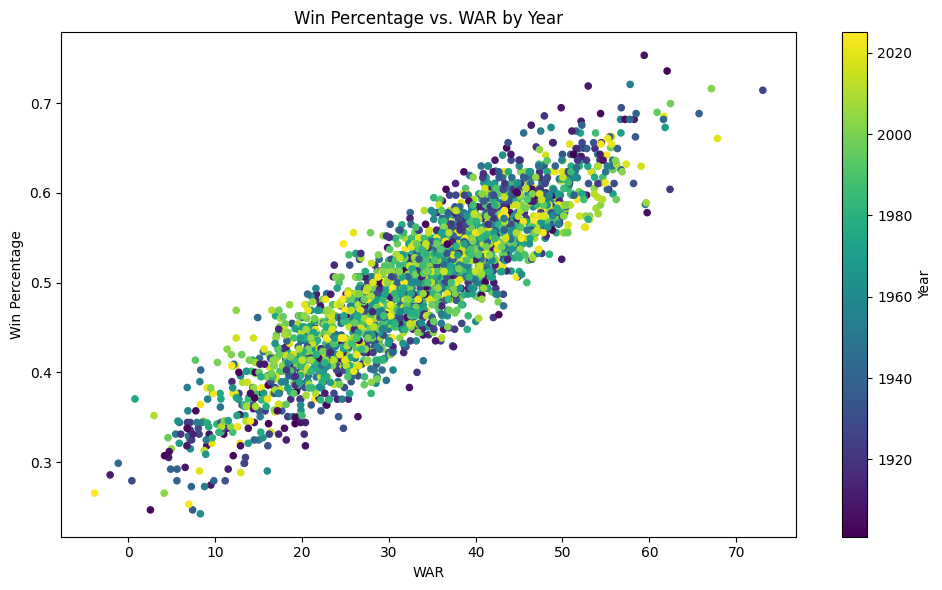
The output implies a 29% win percentage for a “replacement” level team, and a 0.64% win rate increase per cumulative WAR. These values are in line with previous analyses which use different sample periods. Indeed, the two values can be clearly seen to be tightly correlated:
Luck vs. WAR
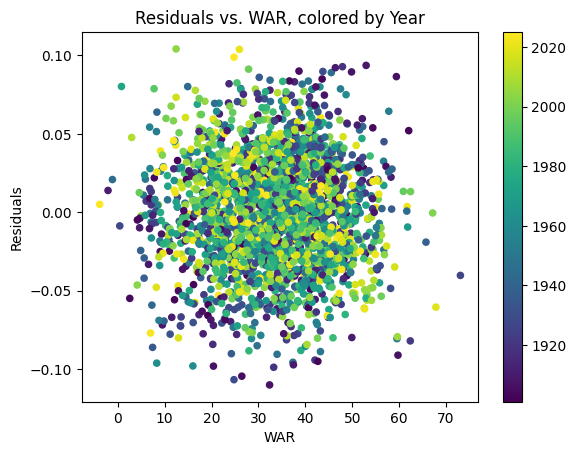
Unlike previous analyses, I’m not interested in what WAR does measure, but rather, what it doesn’t. When does WAR get it wrong and why? Are certain teams just lucky? To answer this, I calculate the residuals of the regression equation–that is, the difference between the actual win percentage of each team and the expected win percentage based on their cumulative WAR. Plotting the residuals, WAR is not a biased statistic–the regression equation is just as good at estimating win percentage for low-WAR teams as it is for high-WAR teams.
However, we do see that there is some variation over time, more neatly displayed in the graph below.
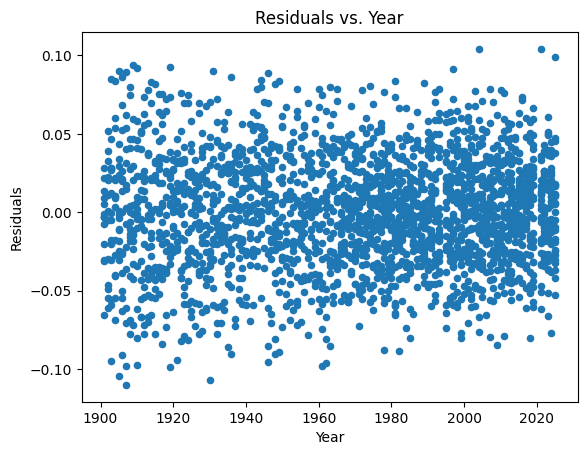
Clearly, WAR is not as effective as a statistic in the earlier years of our sample. In more recent years, we’ve seen higher predictability.
See below for tables of the residuals. I’ve broken the residuals out by century so we have rankings for 1901-1999 and 2000-2025 separately.
Top 5 Residuals / Top Overachievers (1901-1999)
| Team | Year | WAR | Win % | Predicted Win % | Residual |
|---|---|---|---|---|---|
| Pittsburgh Pirates | 1909 | 52.9 | 71.9% | 62.5% | 9.4% |
| Cincinnati Reds | 1919 | 47.9 | 68.6% | 59.3% | 9.3% |
| Chicago Cubs | 1910 | 46.4 | 67.5% | 58.3% | 9.2% |
| San Francisco Giants | 1997 | 27.9 | 55.6% | 46.4% | 9.1% |
| Pittsburgh Pirates | 1905 | 38.6 | 62.3% | 53.3% | 9.0% |
Bottom 5 Residuals / Biggest Underachievers (1901-1999)
| Team | Year | WAR | Win % | Predicted Win % | Residual |
|---|---|---|---|---|---|
| Washington Senators | 1907 | 20.4 | 31.8% | 41.6% | -9.8% |
| Washington Senators | 1919 | 33.2 | 40.0% | 49.9% | -9.9% |
| St. Louis Browns | 1905 | 26.4 | 35.1% | 45.5% | -10.4% |
| Boston Red Sox | 1930 | 24.7 | 33.8% | 44.4% | 10.7% |
| Boston Red Sox | 1907 | 32.3 | 38.3% | 49.3% | -11.0% |
Here we have the unluckiest team of all time, the 1907 Boston Red Sox (who were known as the Boston Americans at the time). Their season started off with tragedy when player-manager Chick Stahl committed suicide in spring training. The team would have four different managers throughout the rest of the season, and later went on to have an 0-16-2 run of games in September, capping off the season with a 59-90 record.
Top 5 Residuals / Top Overachievers (2000-2025)
| Team | Year | WAR | Win % | Predicted Win % | Residual |
|---|---|---|---|---|---|
| Cincinnati Reds | 2004 | 12.4 | 46.9% | 36.5% | 10.4% |
| Seattle Mariners | 2021 | 25.9 | 55.6% | 45.2% | 10.4% |
| Cleveland Guardians | 2025 | 24.7 | 54.3% | 44.4% | 9.9% |
| Arizona Diamondbacks | 2007 | 29.3 | 55.2% | 47.4% | 7.8% |
| Houston Astros | 2010 | 16.5 | 46.9% | 39.1% | 7.8% |
There we have it; we’ve identified the luckiest teams of all time–the 2004 Reds and the 2021 Mariners. The Reds, with their mediocre 12.4 WAR, exceeded the prediction by winning 17 games more than expected. If WAR is to be trusted, then this overperformance was nothing more than a fluke: in both 2003 and 2005 the team had a worse record than in 2004.
The 2021 Mariners had a similar overperformance, but unlike the Reds, have put together a string of wildly successful (for franchise standards) seasons since then.
Bottom 5 Residuals / Biggest Underachievers (2000-2025)
| Team | Year | WAR | Win % | Predicted Win % | Residual |
|---|---|---|---|---|---|
| Chicago White Sox | 2024 | 6.9 | 25.3% | 33.0% | -7.7% |
| Kansas City Royals | 2011 | 36.0 | 43.8% | 51.7% | -7.9% |
| Boston Red Sox | 2007 | 59.6 | 58.9% | 66.8% | -7.9% |
| Baltimore Orioles | 2018 | 12.9 | 28.8% | 36.8% | -8.0% |
| Toronto Blue Jays | 2009 | 40.3 | 46.0% | 54.4% | -8.4% |
What does WAR fail to consider? WAR is intended to be adjusted based on the strength of competition and environmental/ballpark factors, though this is not as direct as a simple strength of schedule comparison. Obviously, WAR can also not capture subjective factors like “locker room presence” or even luck. As a result, we see that a team is often worth more than the sum of its parts.
WAR heroes (and losers)
In addition to calculating the biggest team over- and under-achievers, I also find the players on these rosters. In particular, I calculate the average team residual for all players over the course of their careers. See the tables below for results (active players with 5+ seasons only):
Top 5 Residuals / Top Overachievers
| Player | Avg. Team Residual |
|---|---|
| Carlos Santana | 4.1% |
| Willy Adames | 2.5% |
| Freddie Freeman | 2.5% |
| Will Smith | 1.8% |
| Ke’Bryan Hayes | 1.7% |
Santana’s average residual of 4.1% means his teams won ~6.6 more games on average than what their WAR would predict. Most notably, he was part of the 2025 Cleveland Guardians who won 16 more games than their WAR-based prediction.
Bottom 5 Residuals / Biggest Underachievers
| Player | Avg. Team Residual |
|---|---|
| Alex Bregman | -2.1% |
| Juan Soto | -2.1% |
| Luis Robert Jr. | -2.5% |
| Carlos Correa | -2.5% |
| Marcus Semien | -2.8% |
No surprise to see so many alum of the 2019 Astros, who boast one of the highest WARs of all time and whose impressive 66% win rate was still 6% below their WAR-predicted rate of 72%.