Is ignorance bliss? Salt Lake County restaurant health inspection grades, ranked best to worst.
Salt Lake County’s Health Department collects great data on different types of establishments’ adherence to health and safety guidelines. I thought it’d be interesting to grab this data, specifically for restaurants, and see who are the worst offenders. If you don’t share my natural curiosity for this, I’d recommend turning back now. Otherwise, read on for insights on the cleanest (and dirtiest) restaurants in the county as well as some county-wide trends and maps.
Dataset
The data comes from the Salt Lake County Health Department’s Inspections page. I scraped this data on 9/14/2024. It includes (up to) the ten most recent inspections for all currently in-business, or recently out-of-business, establishments. The dataset includes 5,311 establishments and 31,745 individual inspections.
Definitions
The Health Department has two different ways of measuring establishments: a relative ranking and an absolute score.
The ranking value is expressed as a percentage of establishments with a similar “risk level” that perform worse on health and safety, where all establishments are grouped into one of four risk levels based on probability of contamination. For example, if a sushi restaurant has a ranking of 45%, that means it scores better than 45% of similar establishments (worse than 55%). Higher rankings are better.
The score value is a cumulation of strikes against an establishment for health and safety violations, where each strike counts as 1, 3, or 6 points depending on severity. There is no upper limit on an establishment’s score. Lower scores are better.
The median score out of all inspections is 12, with 75% of inspections scoring a 24 or lower and 25% of inspections scoring a 5 or lower.
You can read more about rankings, scores, and risk levels on the Health Department’s website.
Methods
The approach I used to grab the data consists of a simple scraper that submits parameters to the site’s ASP.NET form and paginates to retrieve all data. To retrieve latitude and longitude coordinates for mapping purposes, I use the geopy package to geocode the provided addresses.
The code can be accessed at my GitHub.
Conclusions
The Good - highest ranked establishments
Below are the top 5 rankings by type for bar, coffee shop, food truck, and restaurant types. There are a lot of weird records in the data (dog patios, duplicates, and mis-categorized establishments) that I’ve manually excluded. Remember that high rankings are good, and high scores are bad.
In summary, if you care solely about sanitation standards, I’d recommend eating and drinking at high-end hotels and large chains.
Bars
- Alta’s Rustler Lodge (100% rating; max score of 8)
- Hilton SLC Lounge (100%; 12)
- Grand America Hotel - The Gibson Lounge, SLC (100%; 14)
- Baldy Brews at the Alta Watson Shelter (100%; 25)
- Bongo Lounge, SLC (93%, 14)
Coffee Shops / Cafes
- Starbucks, various locations; best location is in the 8th S 9th E Smith’s (100% rating; max score of 6)
- 3 Cups, Woodbine Food Hall, SLC (100%; 12)
- Beans and Brews, various locations; best location is in the airport (96%; 15)
- Brio Cafe in the University of Utah’s Biology Building (93%; 14)
- District Coffee Co, SLC (93%; 15)
Food Carts & Trucks
- La Catrina Flavors of Mexico, South Salt Lake (100% rating; max score of 7)
- Smoke-A-Billy BBQ & Grill, South Salt Lake (100%; 7)
- Pig Boys, Millcreek (100%; 8)
- Tacos El Conde, SLC (100%; 9)
- Touch of Polynesia, West Valley City (100%; 9)
Restaurants
- Fillings and Emulsions in the airport (100% rating; max score of 3)
- Sweetaly Gelato, Holladay (100% rating; max score of 3)
- Wendy’s, various locations; best location is 5673 W 6200 S, West Valley City (100%; 4)
- McDonald’s, various locations; best location is 2310 E 2100 S, SLC (100%; 20)
- In-N-Out Burger, various locations; best location is 7206 S Union Park Ave, Midvale (99%; 7)
The Bad - lowest ranked establishments
Below are the bottom 5 rankings by type for bar, coffee shop, food truck, and restaurant types. As before, I’ve manually excluded any unusual data.
In summary, if you care solely about sanitation standards, I’d avoid eating and drinking at buffets, smaller mom-and-pop places, and bars in Midvale for some reason.
Bars
- Cruzrs Saloon, Holladay (0% rating; max score of 80)
- Old Towne Tavern, Midvale (1%; 69)
- Midway Tavern, Midvale (3%; 93)
- VFW Bar, SLC (3%; 64)
- A Bar Named Sue, Midvale (4%; 64)
Coffee Shops / Cafes
- Mestizo Coffeehouse, SLC (1% rating; max score of 113)
- Rise & Grind Coffee, Midvale (2%; 42)
- Higher Ground Coffee, SLC (4%; 36)
- Tres Gatos Coffee, Midvale (4%; 35)
- Beard Papa’s, South Jordan (7%; 30)
Food Carts & Trucks
- Latinus, SLC (0% rating; max score of 143)
- El Rey Del Taco, SLC (0%; 132)
- Lulu’s Corndogs, Sandy (0%; 129)
- Pamortigua, Murray (0%; 44)
- La Abejita, West Valley City (0%; 27)
Restaurants
- King Buffet, South Salt Lake (0% rating; max score of 266)
- La Frontera, Millcreek (0%; 240)
- Eiko Cafe, Sandy (0%; 224)
- Cafe Thảo Mi, Taylorsville (0%; 215)
- El Rico Sanguchom D’Chalo, West Valley City (0%; 213)
The Ugly - the worst individual inspections
Below are the worst individual inspections in the dataset, ranked on total score (high = bad).
-
King Buffet, South Salt Lake - April 25, 2024 (266 Total Score; 28 Critical Violations)
This legendarily bad inspection includes tales of live cockroaches, poor handwashing, mislabeled chemicals, and shellfish being kept at improper temperatures
-
Seafood Bucket Cajun Style, South Salt Lake - July 8, 2024 (263; 29)
for general uncleanliness, including backed up sewage and excess flies
-
J & C House, Riverton - August 4, 2022 (253; 27)
for improper seafood storage, manager being unable to demonstrate basic sanitation knowledge, and employees touching cooked food without gloves
-
Sweet Spot Bakery & Cafe, Sandy - August 28, 2023 (251; 26)
for not having a food safety manager or any individual designated “in-charge,” storing Raid in the kitchen, food temperature abuse, and general dirtiness
-
Fortune Cookie, Riverton - February 28, 2023 (251; 26)
for inadequate refrigeration and a faulty dishwasher, among various other violations
Overall Trends
Scores Over Time
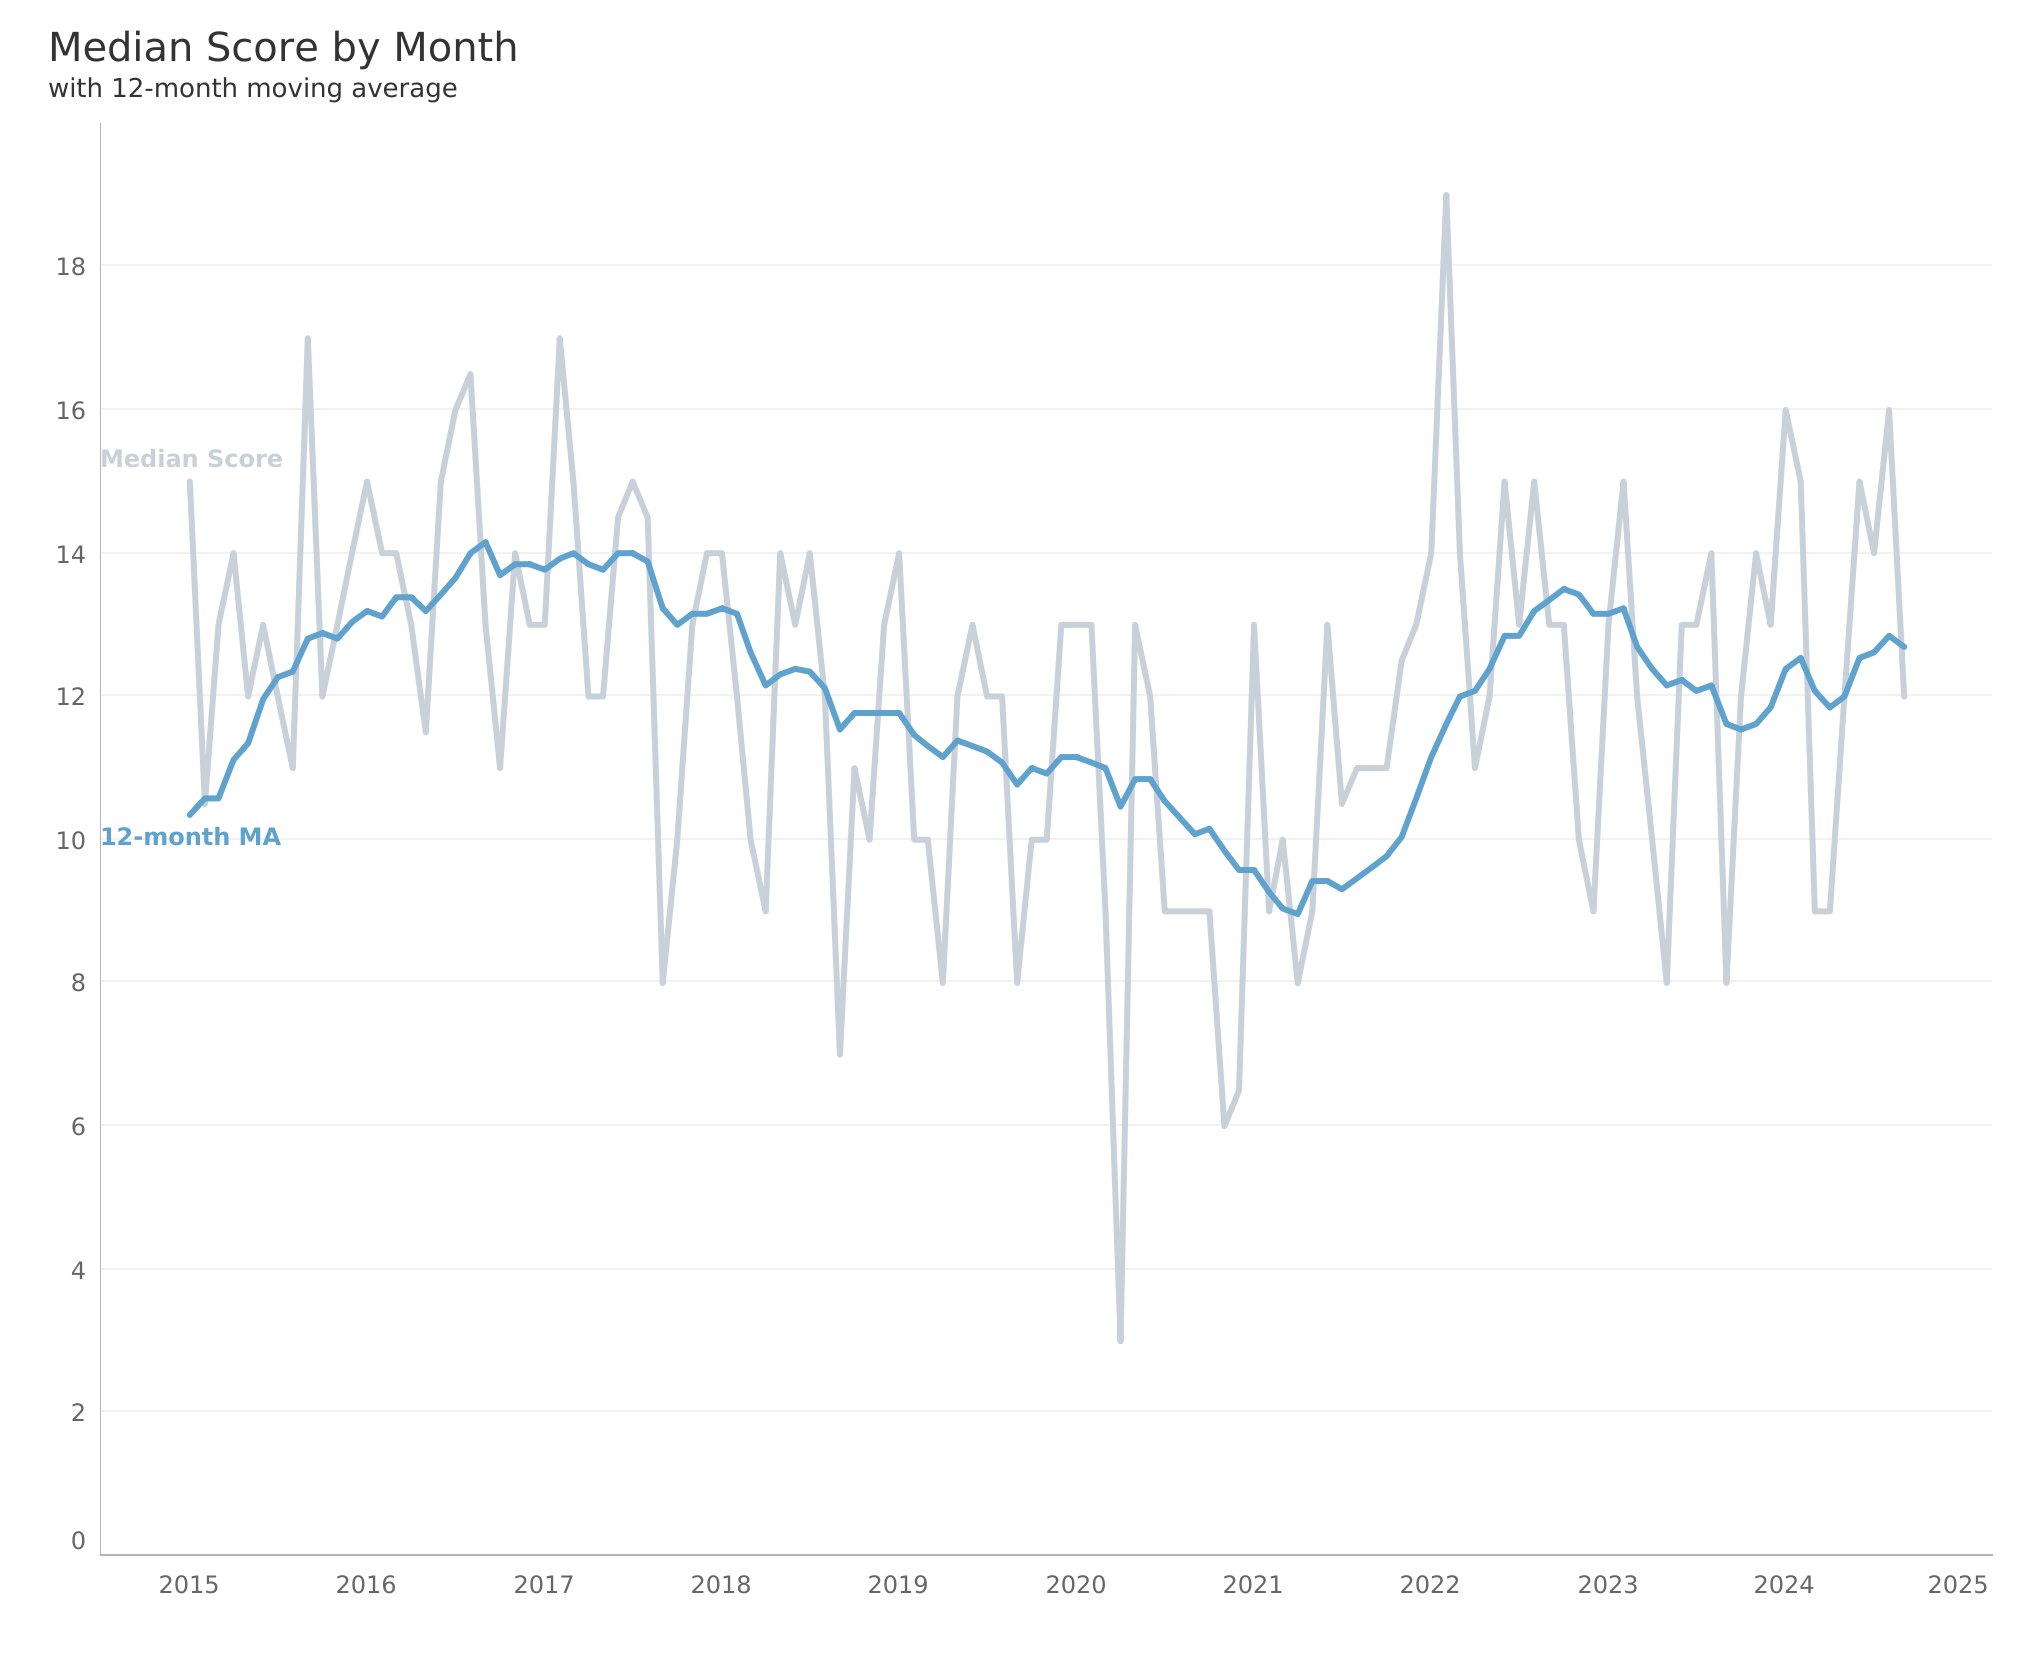
See the graph below of median inspection score by month. Scores dropped leading up to 2020 and further sank during COVID. We are currently seeing an upswing in scores.

Scores by Geography
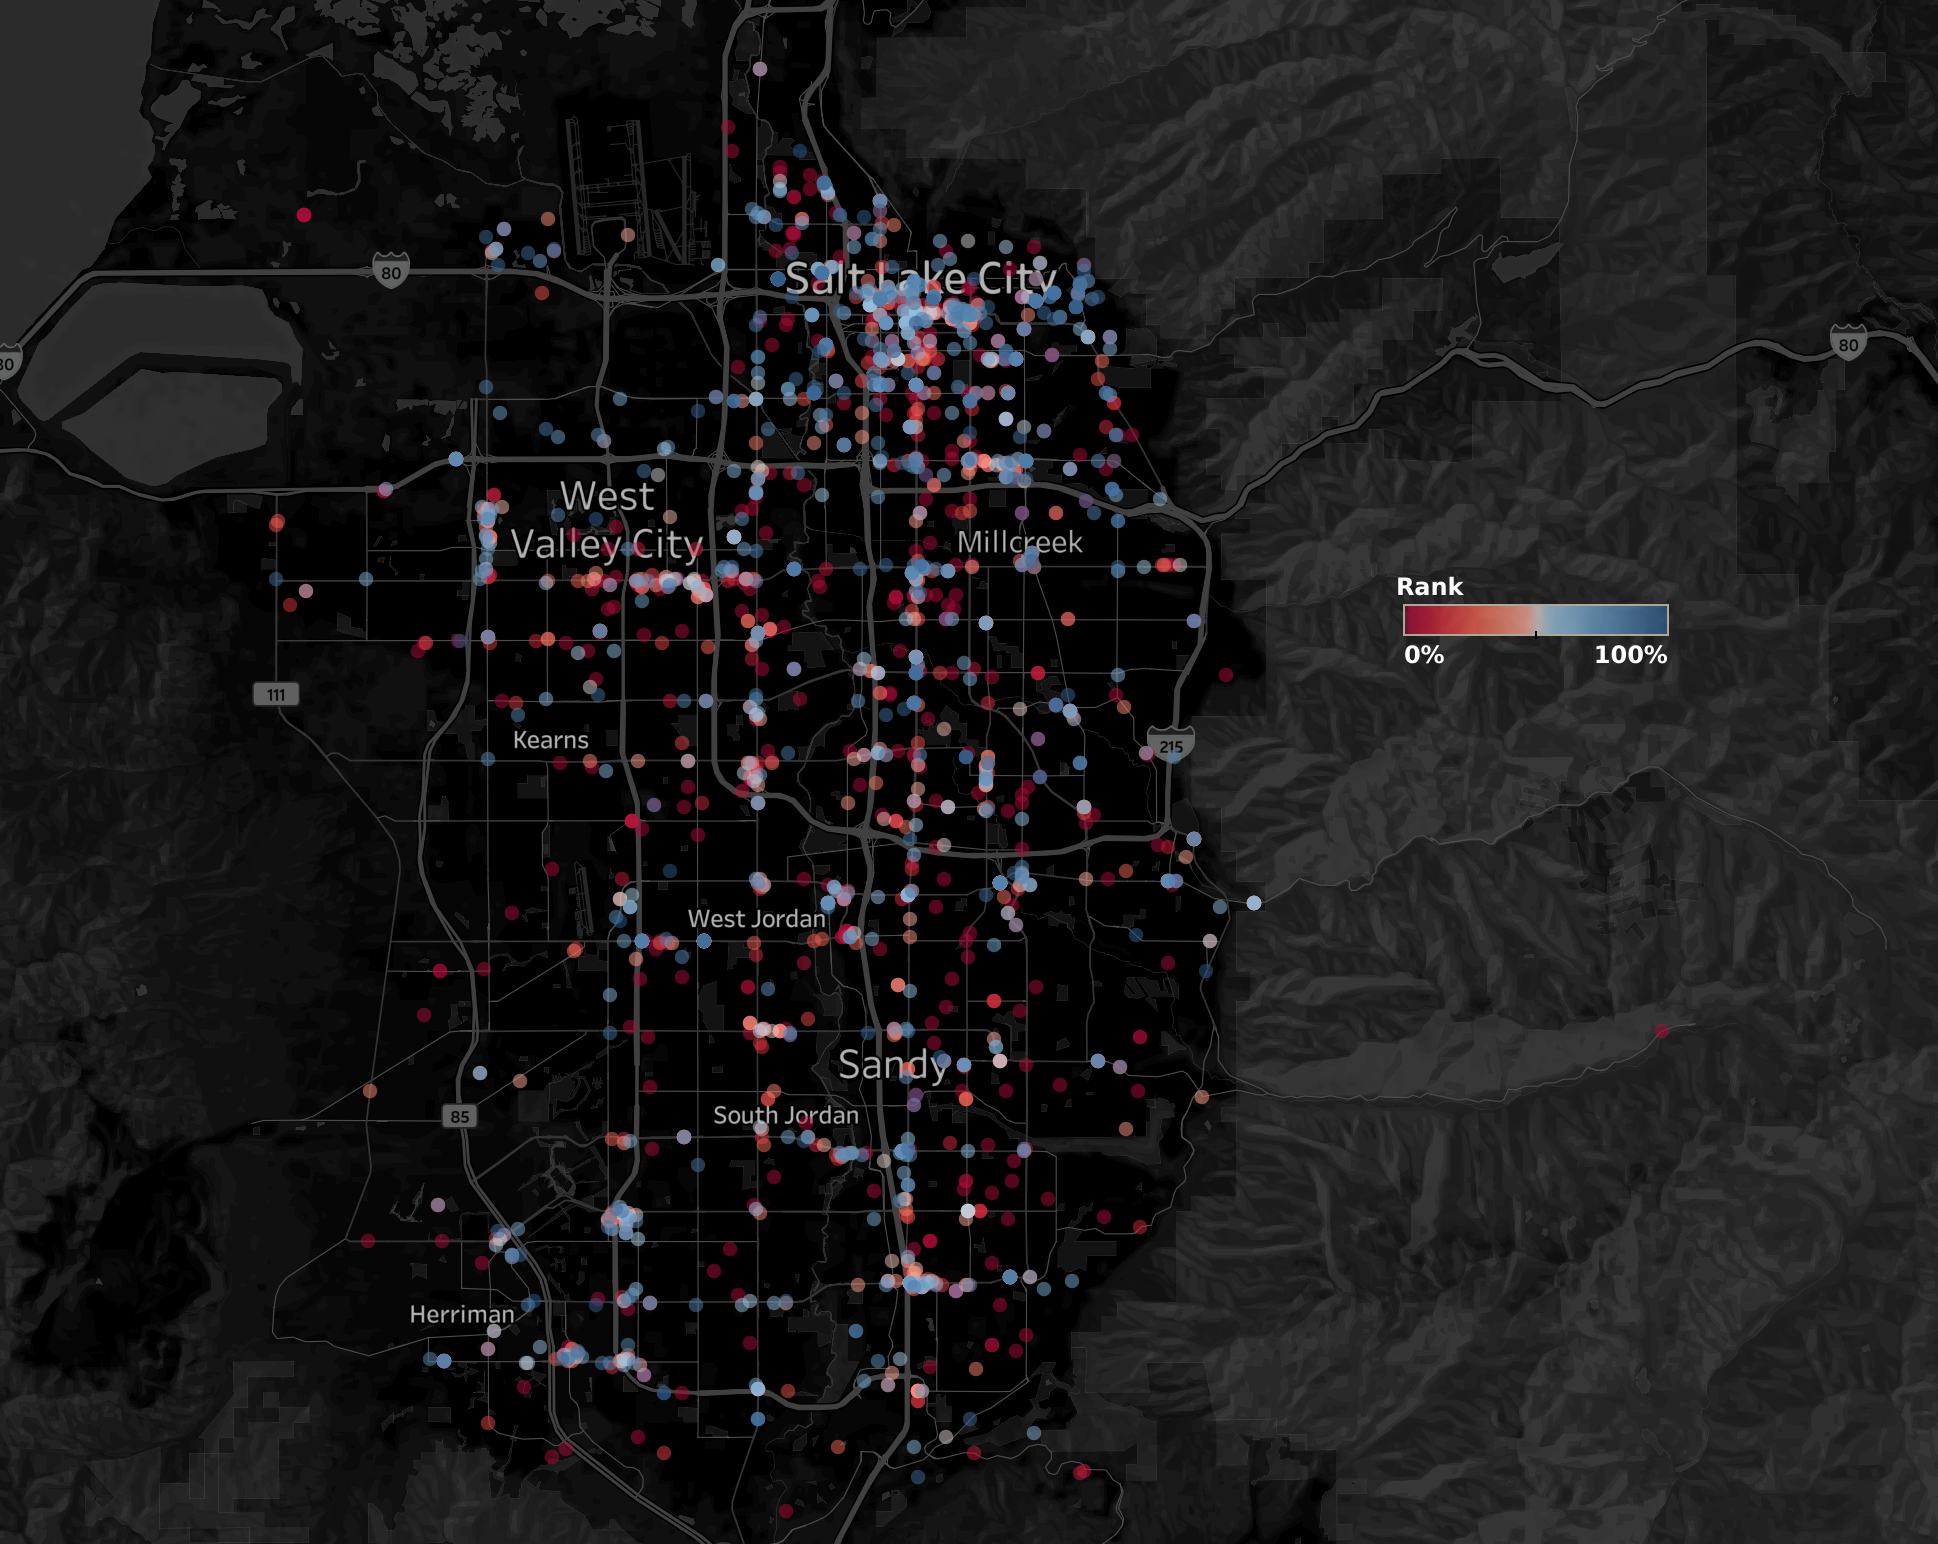
See a map below of ranks. There is a rough correlation between both latitude and rank, and longitude and rank, meaning establishments in the northeast corner in the city tend to have better ranks than those in the southeast corner.

To further investigate this effect, I’ve sorted the cities of the county by median establishment rank:
Top 5 Cities
- Alta (85%)
- Bluffdale (76%)
- Sandy (60%)
- South Salt Lake (59%)
- SLC (58%)
Bottom 5 Cities
- Midvale (33%)
- West Valley City (39%)
- Taylorsville (39%)
- Draper (39%)
- West Jordan (40%)
Dashboard
See the entire interactive dashboard below